Cvent: Data Visualization

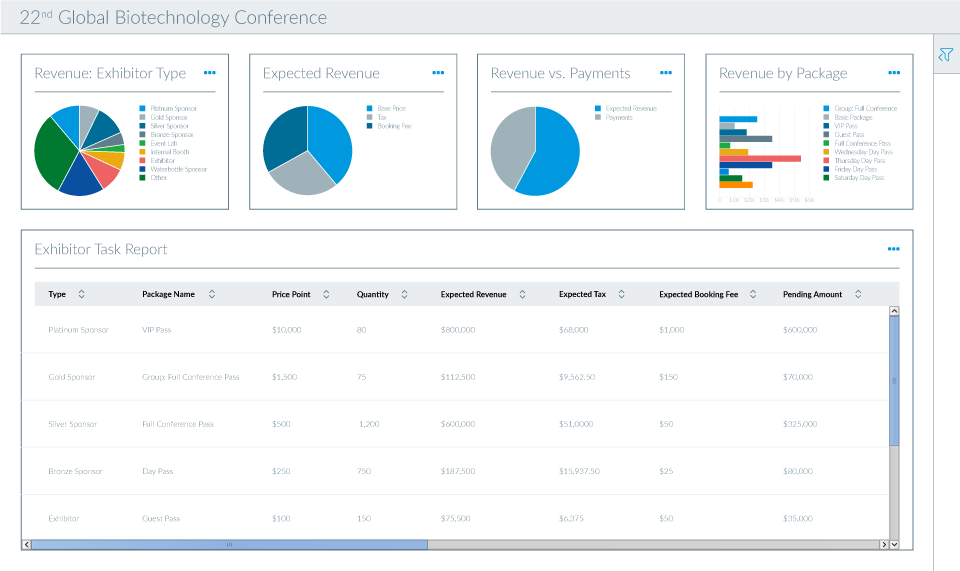
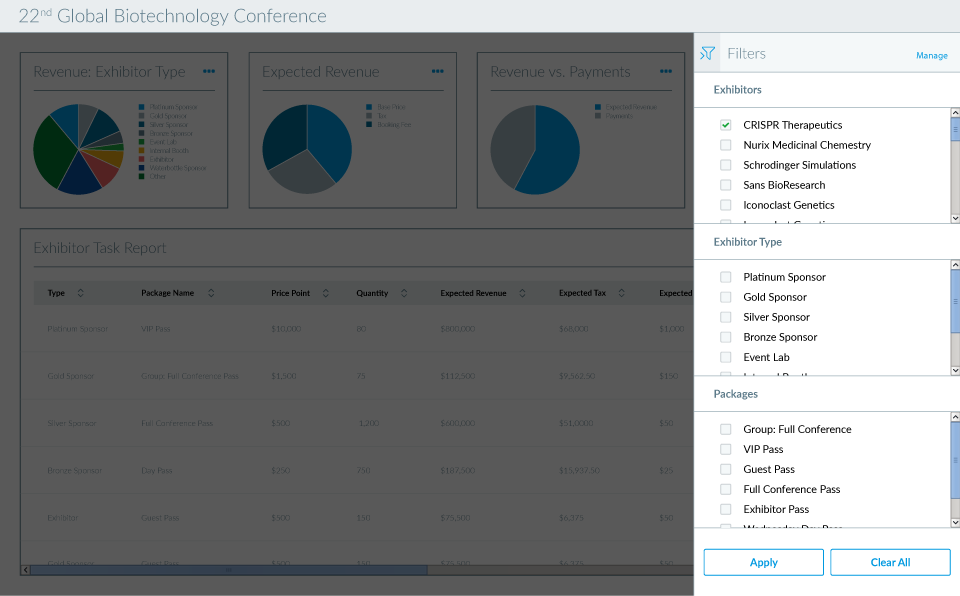
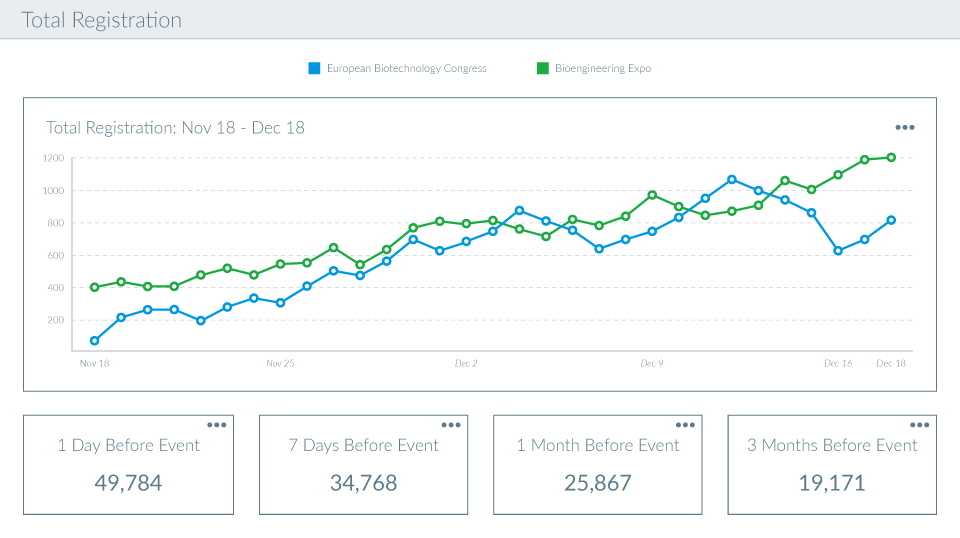
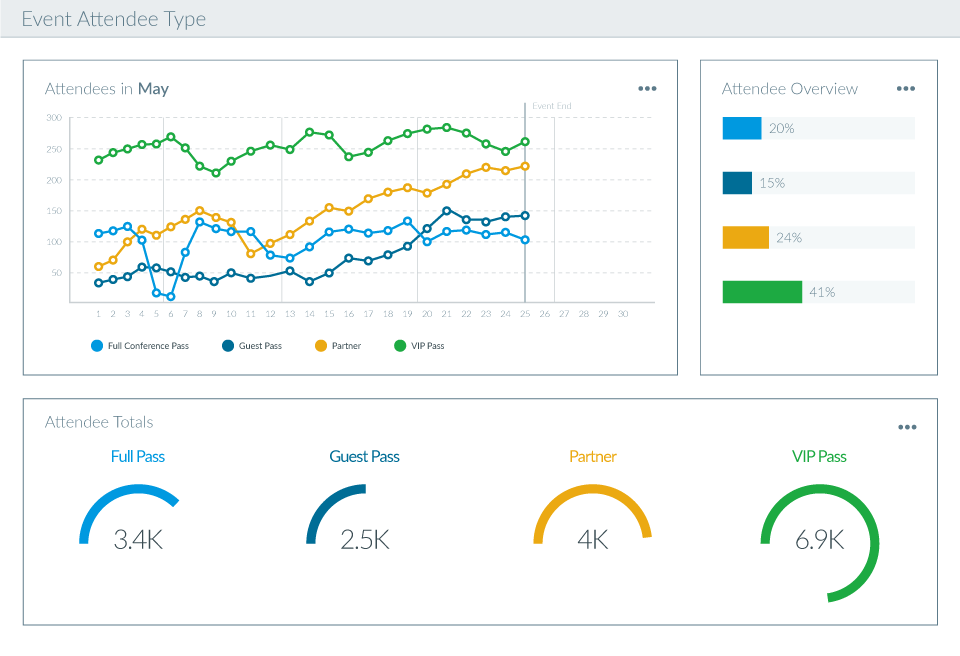
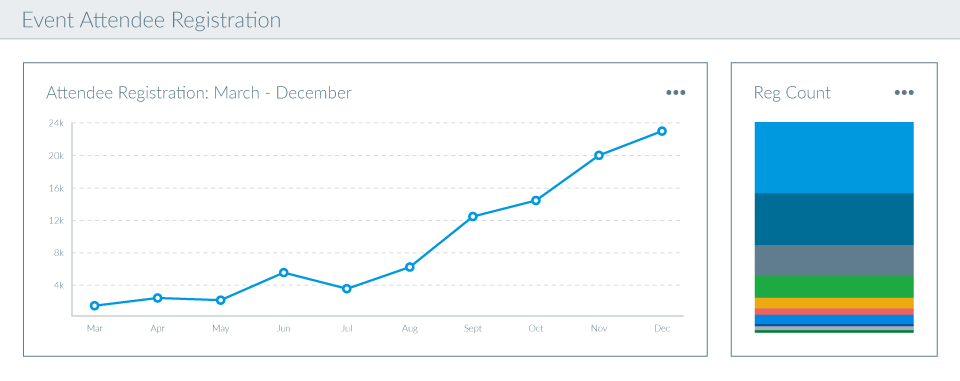
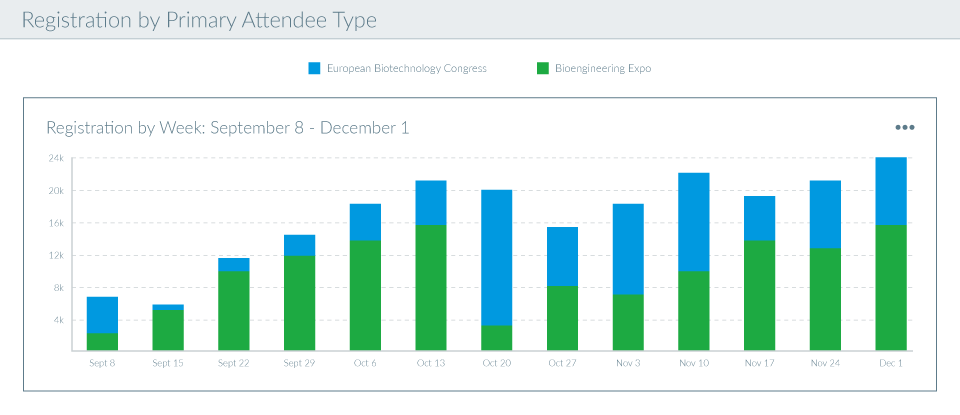
Cvent’s enterprise-level clients needed an intuitive way to view graphic representations of large data sets. Using a Tableau back-end and a custom implementation of d3.js, I designed charts and infographics that communicated information clearly and efficiently.

Project

Data Visualization

Client

Cvent

Role

User experience, art direction, strategy, design

Cvent Data Visualization: Charts and table displaying exhibitor revenue by event Cvent Data Visualization: Filter overlay for charts and table displaying exhibitor revenue by event Cvent Data Visualization: Line graph displaying total registration by event Cvent Data Visualization: Grayscale design displaying charts, bar graphs and table Cvent Data Visualization: Line graphs, bar charts, and circle graph displaying event attendee types Cvent Data Visualization: Line graph, and stacked bar chart displaying event attendee registation Cvent Data Visualization: Stacked bar chart displaing event registration by primary attendee type